
How to Avoid the Pitfalls of Imperfect Graphical Analogies
We all know the pitfalls of imperfect analogies: they can be reversed to hurt you, elaborate analogies are seldom successful, and fact finders might be motivated to create other imperfect analogies of their own, even when you don’t introduce an analogy. Imperfect graphical analogies create similar perils.
Why do we have trouble conceiving the perfect analogy?
Genter & Smith (1) explain the process of conceiving an analogy starts with an imperfect surface similarity in objects and context before progressing to discover stronger relational structures until the core of a perfect analogy is resolved. Brainstorming with others increases to chances of producing winning concepts because the more comparisons we consider the more similarities we remember and the greater the chance we will discover a perfect analogy.
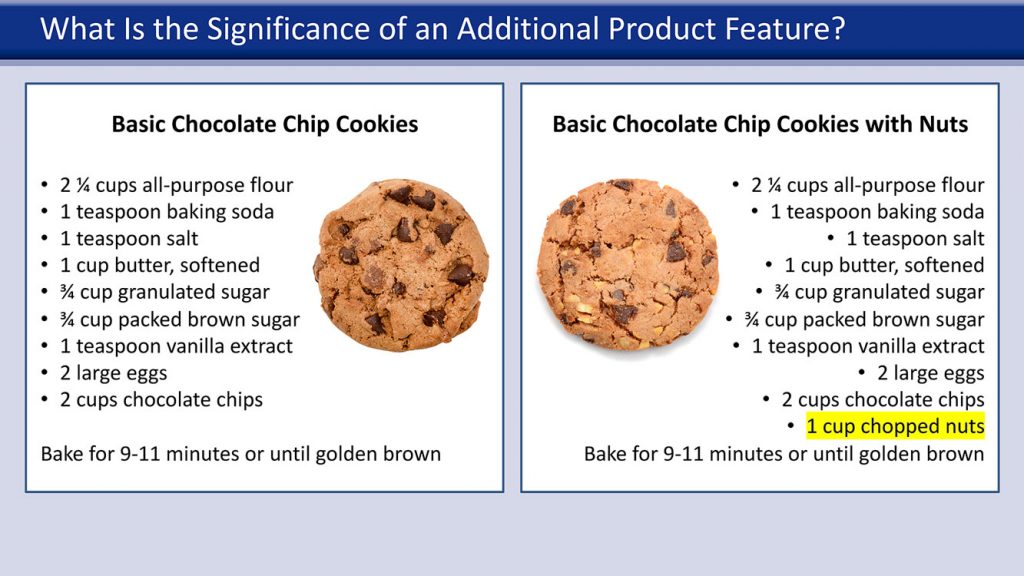
Here’s an example of an analogy for independent and dependent patent claims. The independent claim comprises certain elements and limitations, much like the types and quantities of the components and the cooking instruction in a chocolate chip cookie recipe.
The dependent claim incorporates the elements and limitations of an independent claim and something new, such as nuts in the recipe, or a substitution like almond extract instead of vanilla. This analogy works because recipes are structurally similar to independent and dependent claims and the context is similar: “what is the significance of an additional product feature?”
The challenge of conceiving safe analogies.
We use analogies constantly in daily life and fact finders anticipate lawyers will use them occasionally. This is especially true when tasked with learning new and unfamiliar information because analogies are a fundamental aspect of human cognition (Id.). The lawyer’s challenge is to craft a close relational match impervious to damaging reversal.
For example, here is a graphic analogizing the permitted workplace exposure level of a carcinogen (a “source”) represented by the wingspan of a jumbo jet compared to a level measured in the plaintiff’s workplace (a “target”) represented by the wingspan of a butterfly.

While this graphic is visually appealing because the difference in wingspans is dramatic, it is structurally deficient because the source (a chemical measured in volume) has no relational match to the target (different flying objects measured in wingspan width).
Better structural alignment and relational matching is achieved in this graphic contrasting the linear size difference of a 50-nanometer span to a meter compared to the linear size difference of one foot to the height of a large mountain.

Translate the unimaginable.
Nanometers, millions, and billions are concepts very few of us can appreciate without an analogy to something familiar.
A single nanometer is like—what? This analogy contrasts the relationship between a nanometer and a meter compared to an inch and twice the diameter of earth. This graphical analogy could also be used to demonstrate the enormity a billion.

This example places a tiny speck next to a big gridded block to demonstrate the relationship of one and a million. You might consider this analogy is unnecessary because everyone is familiar with a million, right? Perhaps, but how else can we ensure the fact finder will grasp the concept when the emphasis is gross size differential?

Analogies for data graphics.
Because conventional line, column, bar, and pie data charts convey little more than quantity, percentage, or ratio comparisons, an effective complement might be a real-world graphical or illustrative analog.
In this case, the relational similarities between the amounts of benzene exposure in six common environmental situations are compared to the relatively small amount the plaintiff was exposed to in his workplace.

Employing conventional metaphors.
Conceptual and conventional metaphors talk about one subject by referring to another: “trial is like a chess match,” “I’m as hungry as a horse,” or “he’s a walking dictionary.”
For the toxic tort case described above, the defense wanted to graphically emphasize the difference between the remedies available for an injury suffered inside and outside the workplace by adopting a conventional metaphor: “civil remedies are as different from workers’ compensation” as “black is to white” or “apples are to oranges.”

Compare conventions by analogy.
My final example analogizes the validity of using an acceptable convention as a substitute for a codified standard.
This matter focused on the alleged misrepresentation of advertised condominium sizes. The Plaintiff class alleged that a developer routinely misled buyers of luxury condos by purposefully exaggerating the actual square footage of properties. The defense countered no law or code dictate how square footage was supposed to be calculated and that absent a codified standard, the method the developer used was the de facto norm because it was the most popular and well-accepted in the industry.
This graphic below left demonstrates five ways to calculate condominium square footage: (a) total private area to the outside walls of the entire condominium unit; (b) “gross area” per the architectural plan; (c) “net area” per the condominium plan (the most commonly used method); (d) “usable area” (paint-to-paint); and (e) “floor area” without counterspace.


To demonstrate why a dominant convention should not be interpreted as misleading compared to another acceptable convention, we searched examples in different industries such as elevator floor numbering, building height calculations, and dress sizes.
The graphic below right illustrates four conventional methods to calculate high school grades: (a) the most commonly used “4.0 scale;” (b) the 4.5 scale “honors scale;” (c) the 5.0 “advanced placement scale;” and (d) lettered “bell curve.” The takeaway is all methods are appropriate depending on purpose, just as calculating ownership of a space serves one purpose while calculating usable living space serves a different purpose.
Conclusion
Analogies are powerful tools for litigators because they come naturally and are easily accepted by fact finders of every type. However, they “can and will be used against you” if you choose the wrong one.
Jim Gripp is a pioneering founder of Legal Arts, Inc. He has over forty years-experience as a litigation graphics consultant and private investigator. Email Jim at jgripp@legalarts.com. Image: doomu © shutterstock.com
Endnote
Gentner, D. & Smith, L. (2012). “Analogical Reasoning” In V. S. Ramachandran (Ed.) Encyclopedia of Human Behavior (2nd Ed.). pp. 130-136. Oxford, UK: Elsevier. Last retrieved 8 April 2020 at http://groups.psych.northwestern.edu/gentner/papers/gentnerSmith_2012.pdf