How to Simplify Economics for Math-Challenged Triers of Fact
I am math-challenged. Unfortunately, there are many people like me hiding in plain sight who struggle with higher economics. As jurors (and some mediators, arbitrators, and judges), we are overwhelmed by complex formulas or statistics and because we will decide, or at least influence, your client’s fate, simplifying economics should be a high priority for you and your experts.
As a graphics consultant, my role is to be vigilant about identifying potential communication problems. Sometimes, I perceive issues that escape your attention, or are seemingly too elementary to concern your forensic economist. In my quest to filter information through a visual lens I ask: What does it mean? Why is it important? What is the intended takeaway? What is the best way to communicate it? And how can the message be visualized?
Line, bar, column, pie, and tabular charts are easy solutions because you can plug numbers into an app and out pops a functional graphic. Forensic economists favor them because they’re easy to produce. Unfortunately for some fact finders, that’s about as much work an expert might expend to visually communicate his findings and opinions.
Beyond the easy stuff.
Because utilitarian graphics cannot meet every need, economists need to be creative, or at least be provided creative assistance. For example, you might wish to ground the jury in the economic principles underlying your damages case such as the time value of money. Or your mediator will be better positioned to influence your opponent after learning how a complex lifecare plan is structured and priced. And the judge you guide through multiple transactions in a complex fraud scheme might convince her to rule in your favor on an injunction.
You get the idea. When a decision affecting your client comes down to understanding the math, you can’t assume the fact finder or influencer will understand the economics and reach the right conclusions. Here are examples of how a little creativity made a difference in the outcome.
Tie documentary evidence to multiple fraudulent transactions.
While evidence presentation applications make trying document-intensive cases manageable, a parade of scanned images can accomplish only so much to prove a fraudulent pattern of behavior. Another approach is needed to tie the evidence together by demonstrating connections, establishing temporal context, and quantifying economic harm.
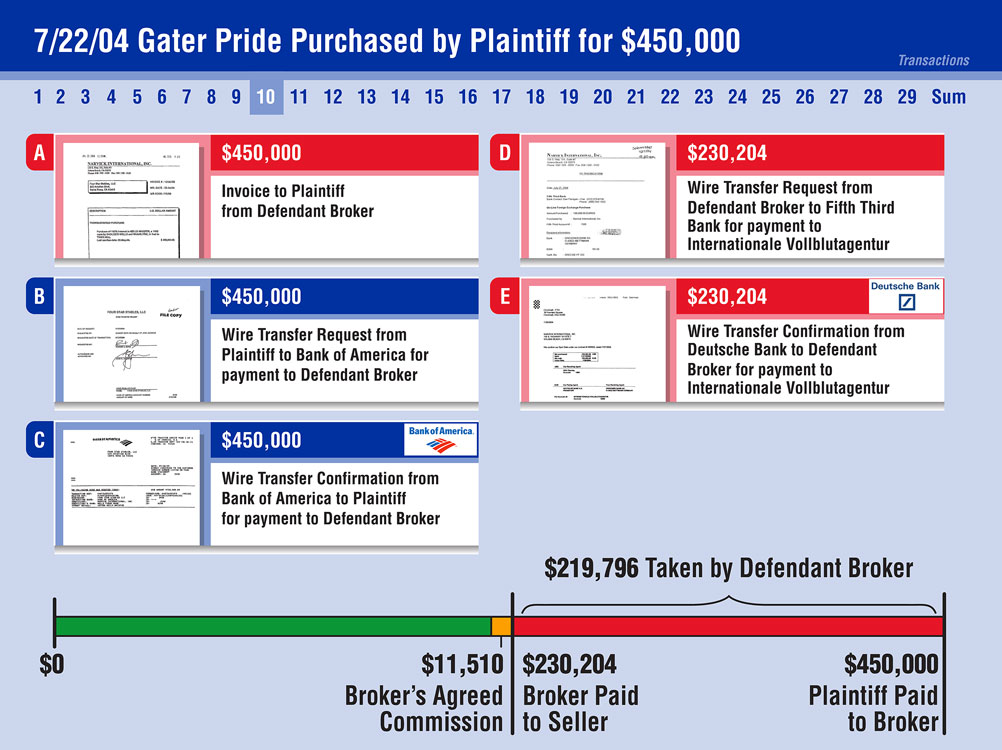
For this fraud and breach of fiduciary duty matter, the defendant purchasing agent bought $11 million of breed stock on behalf of the plaintiff thoroughbred horse farm. The broker was supposed to earn a five percent commission on each purchase but instead falsified every bill-of-sale and pocketed about thirty-five percent of the money paid by the plaintiff over 29 transactions.
The plaintiff counsel’s goal in mediation was to have available concise summaries of over two dozen transactions visualizing the actual sales price, the agent’s proper commission, the inflated sales price, the stolen money, and the underlying documentary evidence. He also needed instant random access to each transaction so he could cherry pick and display the most egregious violations of trust during the joint session to demonstrate the worst a jury would see if settlement was not reached. His strategy worked and the defendant agreed to fully compensate the plaintiff. This was the interactive template I designed for the presentation.
Follow the money to recover assets from offshore entities.
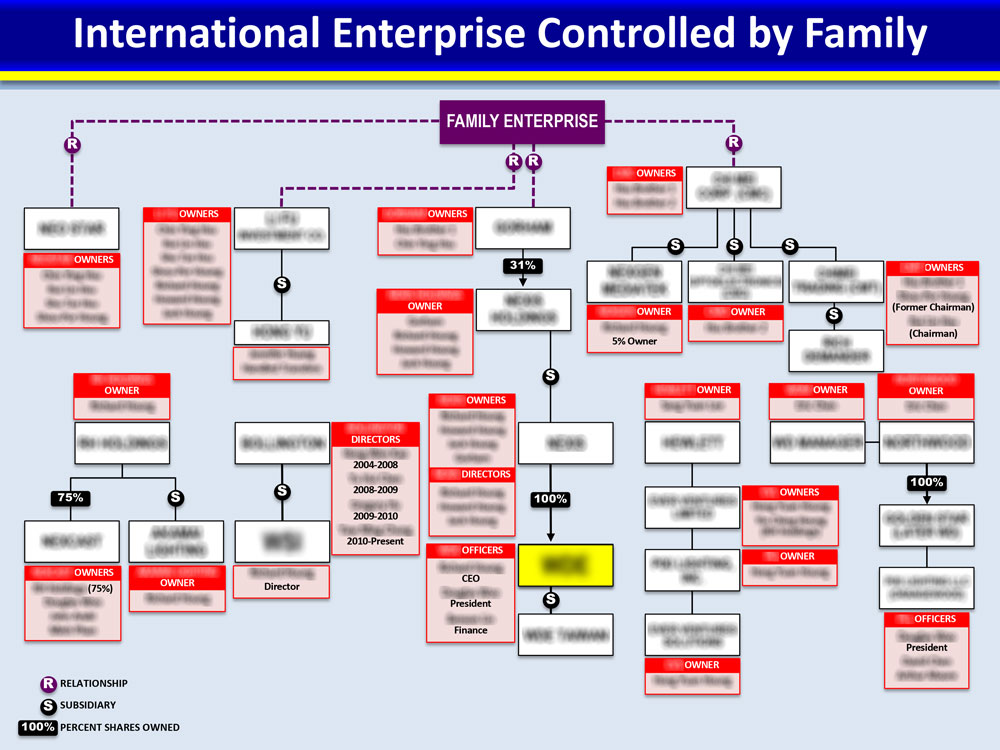
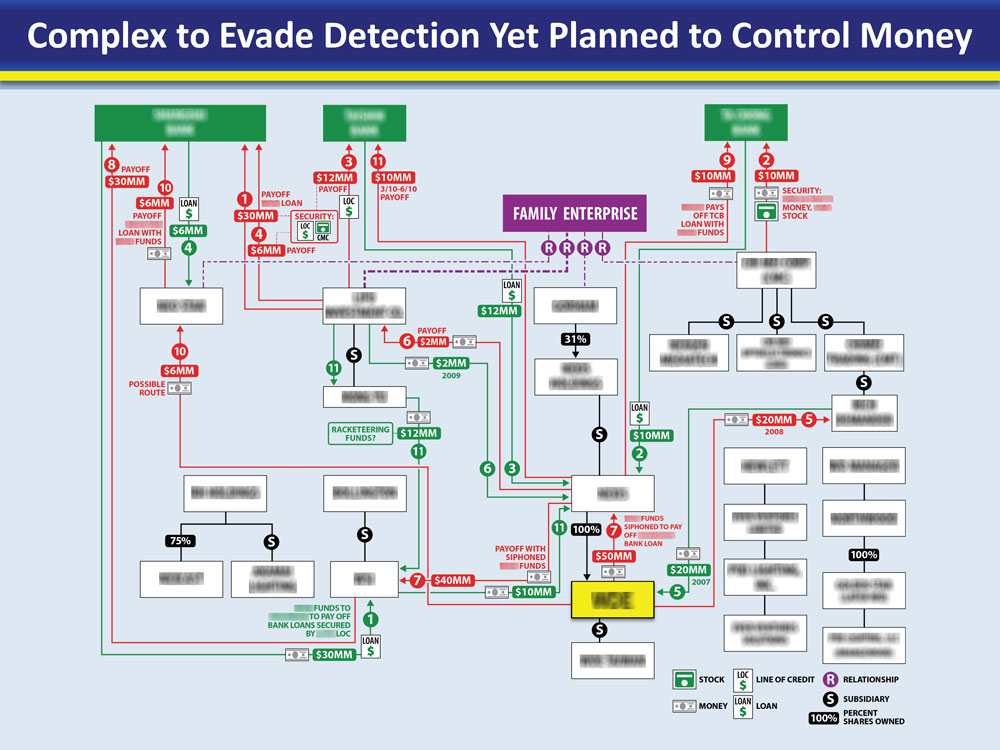
Convoluted racketeering schemes are structured to thwart detection, stymie investigations, and ensure success. In this case, the defendants stole millions of dollars due the plaintiff from the sale of flat screen TVs in the U.S. Instead of paying the plaintiff for the screens it provided, the defendants siphoned off most of the money and directed it to bogus creditors and other intermediaries.
The primary challenge was to locate the defendants’ assets hidden in an intricate web of organizations and transactions and recover the money awarded the plaintiff in earlier litigation. Untangling the intentionally complex money trail involved deconstructing and sequentially reconstructing a spaghetti bowl of parties and transactions.
To demonstrate how the fraud was implemented, we conceived piping diagram-style flow charts identifying the principals of each entity and tracing eleven discrete transactions through the maze of money trails. The case settled on the eve of trial.
Explain long-term damages in a lifecare plan.
When catastrophic personal injuries create a lifetime burden of future economic harm, fact finders need to be persuaded that proposed future treatments and projected expenses are justified and reasonable.
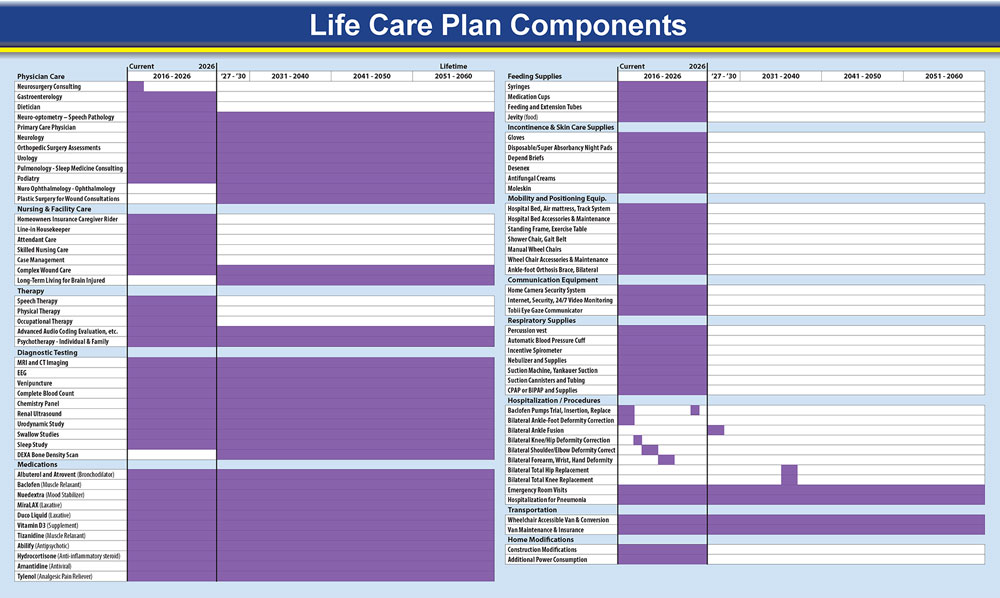
A lifecare plan expert will contemplate future costs in exacting detail, collect current prices, project future cost increases, and calculate a total dollar figure for future care. These might include medical treatments, medications, devices, institutionalization, home remodeling, and transportation needs. An economist will calculate the future cost of money and devise a structured annuity to pay out over the plaintiff’s estimated lifespan.
In this case, the plaintiff suffered permanent debilitating brain and body injuries when her vehicle collided with a semi-trailer operated by a regional transportation company.
Her comprehensive lifecare plan comprised 87-line items of expenses in 8 major categories documented in 20 dense tables. For settlement, her trial counsel requested an at-a-glance summary of the plaintiff’s entire lifetime of care demonstrating the impact to plaintiff and her family five decades into the future. This two-column multi-level timeline accomplished that.
Fortunately, the plaintiff’s treatment needs were not disputed, and an eight-figure settlement was reached shortly before trial.
Illustrate the components of a complex damages formula.
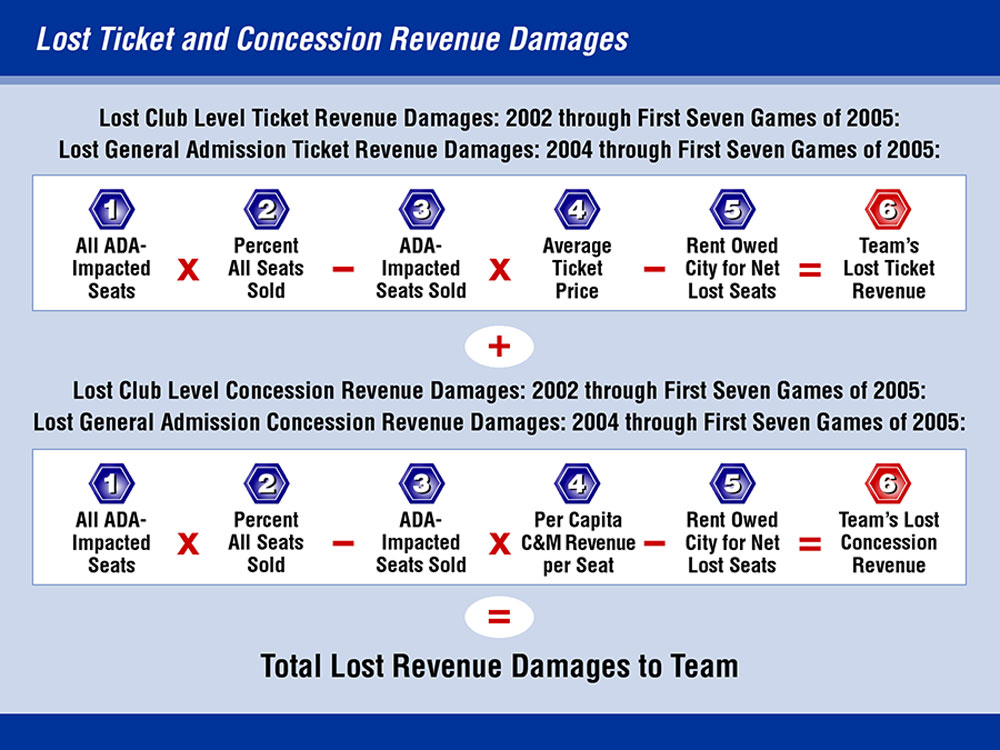
Complex damages formulas can be difficult to comprehend even for experienced arbitrators and jurists. An elegant approach is to build the calculation with illustrated components.
To entice the plaintiff NFL team to remain in its municipal stadium, the defendant City guaranteed certain game-generated revenue to the team. However, after the City settled an ADA-access compliance lawsuit, it was forced to remove about a thousand seats resulting in substantial lost ticket and concession sales revenue over several seasons. Unfortunately for the City, its stadium rental agreement indemnified the team from economic losses attributed to the settlement. The team sought to recover those losses in arbitration.
Because liability was conceded the primary focus was calculating the lost revenue. Each side submitted a dense written damages report and for the plaintiff I designed a visual supplement to its report and a PowerPoint presentation for the oral argument.
My approach provided visual proof of missing seats, explain how the damages formula was structured, and illustrate how each damages component was valued.
To document quantification of lost seats, we attended a sold-out Monday night game and photographed all ADA seating and ADA access paths before and during the game. These images were incorporated into the report supplement and formula charts for lost ticket and concession revenues. The plaintiff was awarded $3.3 million, the exact amount it requested.
The plaintiff won this battle of formulas and was awarded $3.3 million, the exact amount it requested.
Accommodate the math-challenged in deliberations.
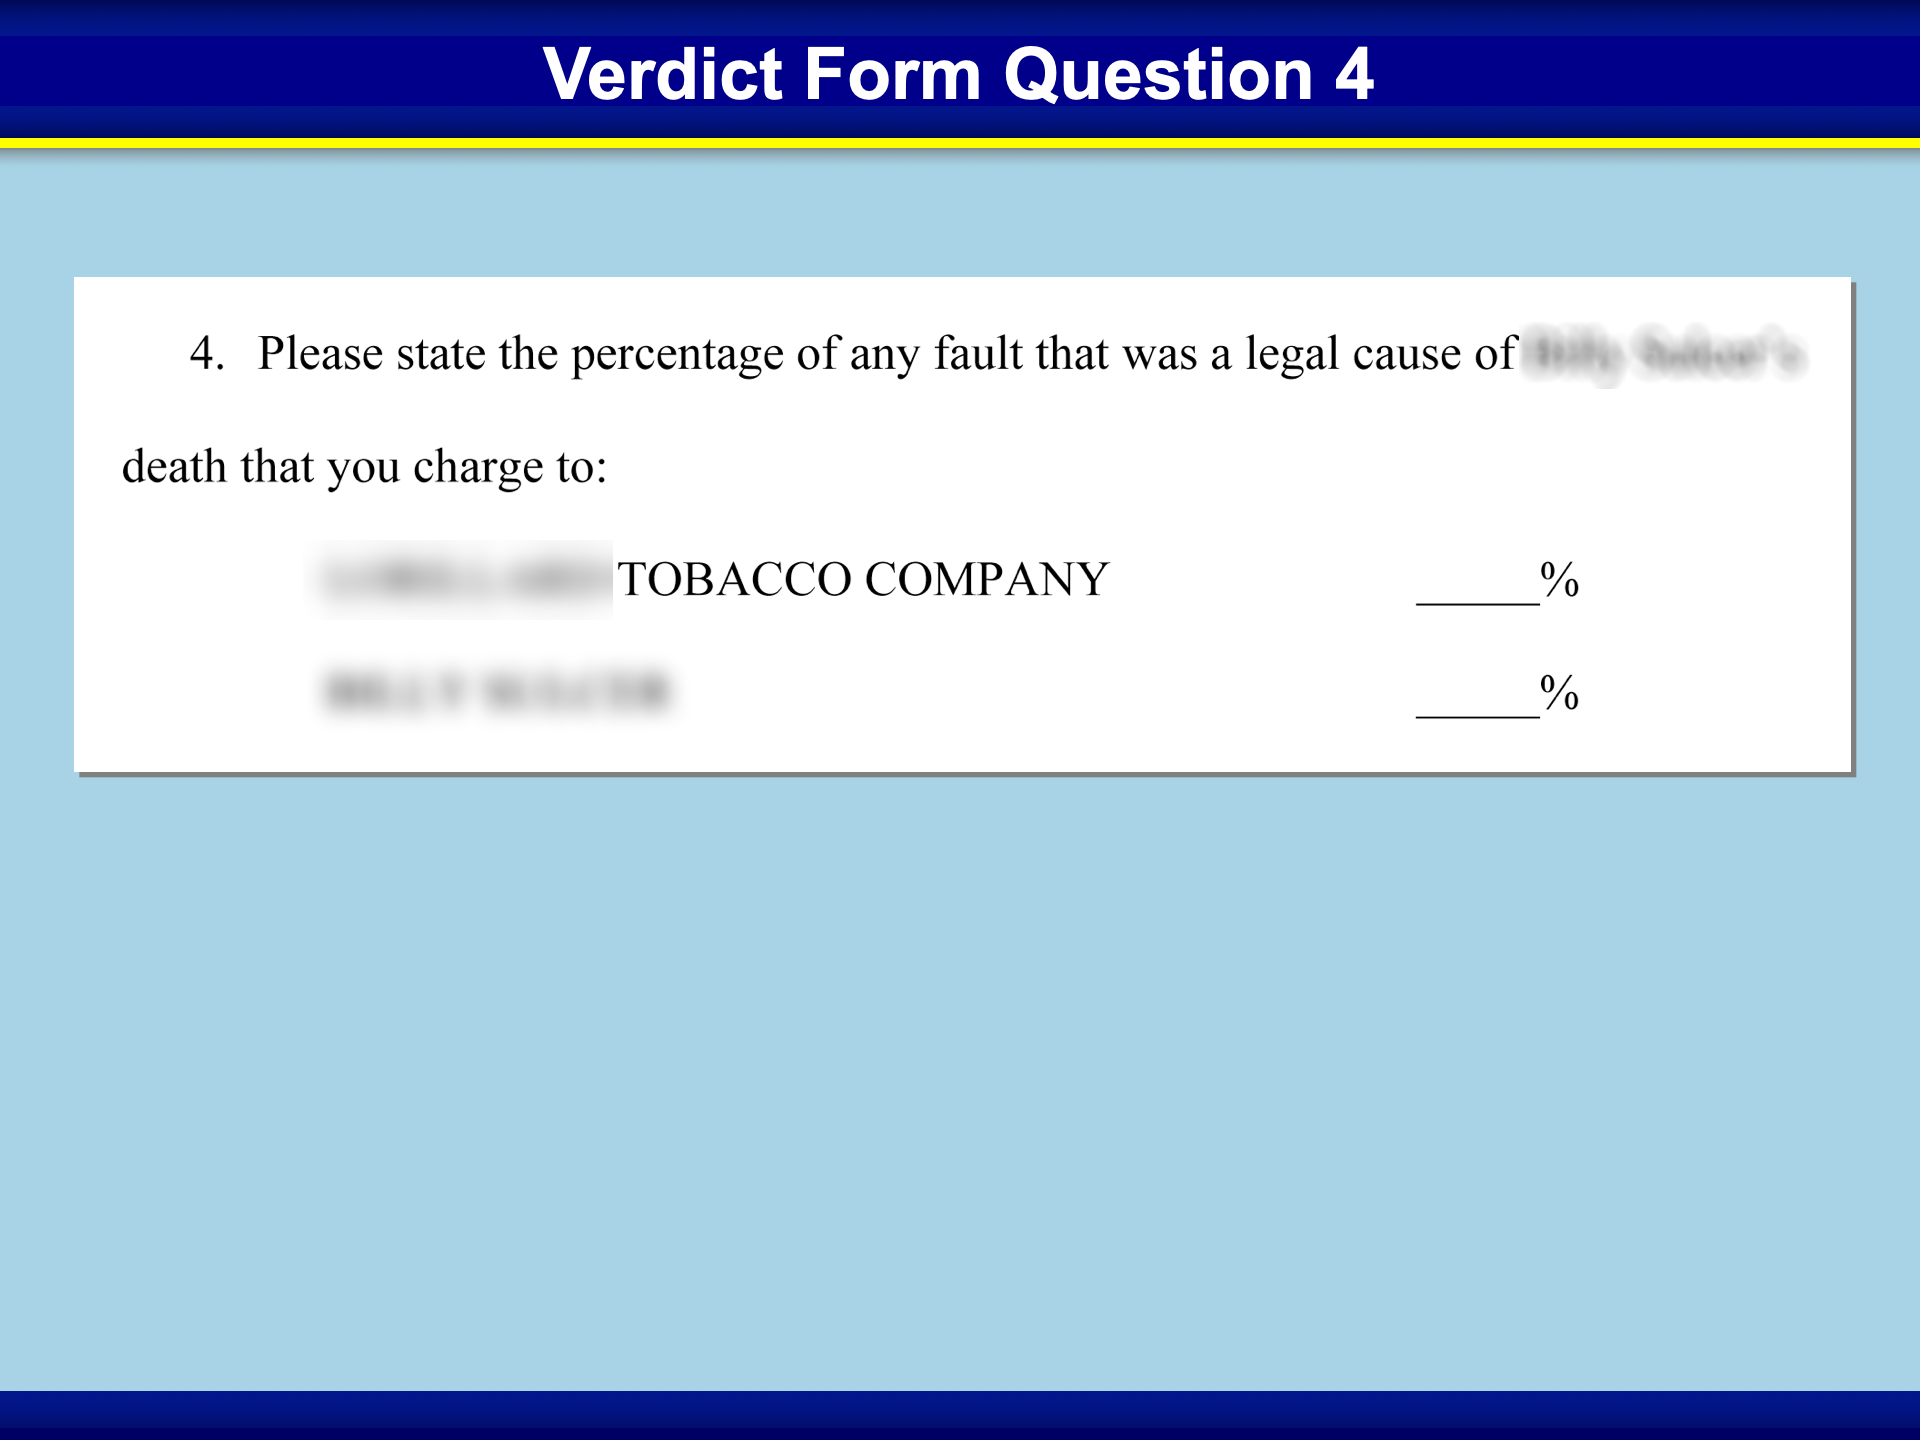
I strongly recommend showing fact finders how to calculate the damages you seek. A prime example of the consequence of not doing the math for the jury occurred in an Engle-progeny tobacco personal injury case in Pensacola, Florida.
After a contentious five-week trial, plaintiff’s counsel requested several million dollars in compensatory and special damages. After finding the smoker 95% at fault the jury returned a plaintiff verdict and damages of $11,250. At first, no one on our defense team understood how this amount was calculated. As it turned out one or more jurors were math-challenged and miscalculated the award.
We determined the jury started with a damages figure of $4.5 million, reduced it 95% to $225,000, and then inexplicably reduced it again 95% to arrive at $11,250. The court entered this amount as final judgment and the case eventually settled for $246,000. But for the plaintiff counsel’s incorrect assumption that average people can do simple math, the smoker’s estate might have reaped substantially more money.
Smart visual communication has broad appeal in mediation and trial.
As a math-challenged individual, my perception of need for explanatory graphics probably differs from the personal perceptions of a numerate forensic economist or the average trial lawyer and is likely aligned more closely with the tobacco case jury.
As a potential fact finder I hope the needs of people like me are considered because otherwise, left to my own devices, I might fail to understand an economic expert’s testimony or accept your justification for damages. In a worst-case scenario, I might even agree with you but misinterpret the jury instructions and miscalculate damages.
Smart visual communication can cure these potential problems. Set aside any assumption that the math will make sense simply because numbers are put on a screen. Instead, consider what the people who decide your client’s fate might need and brainstorm with your trial team how best to meet it. The math-challenged among us will appreciate it.
Jim Gripp is a pioneering founder of Legal Arts, Inc. He has over forty years-experience as a litigation graphics consultant and private investigator. Email Jim at jgripp@legalarts.com.
